It will come as no surprise to most that the demand for accommodation that suits the needs and expectations of our rapidly growing elderly population is a rising pressure on the elderly care home sector. According to the ONS, the population aged 65 years and over is growing faster than other age group, with the fastest future increase to be seen in the 85 years and over age group.
So, how can the elderly care home sector best meet this demand? Here, we highlight the locations with the biggest predicted shortfalls in elderly care home accommodation across Great Britain by 2031, and discuss the key considerations developers, operators and investors should have regard to when exploring how to fulfil the unmet need for elderly care in these markets, both now and in the future.
Demand and shortfall forecast
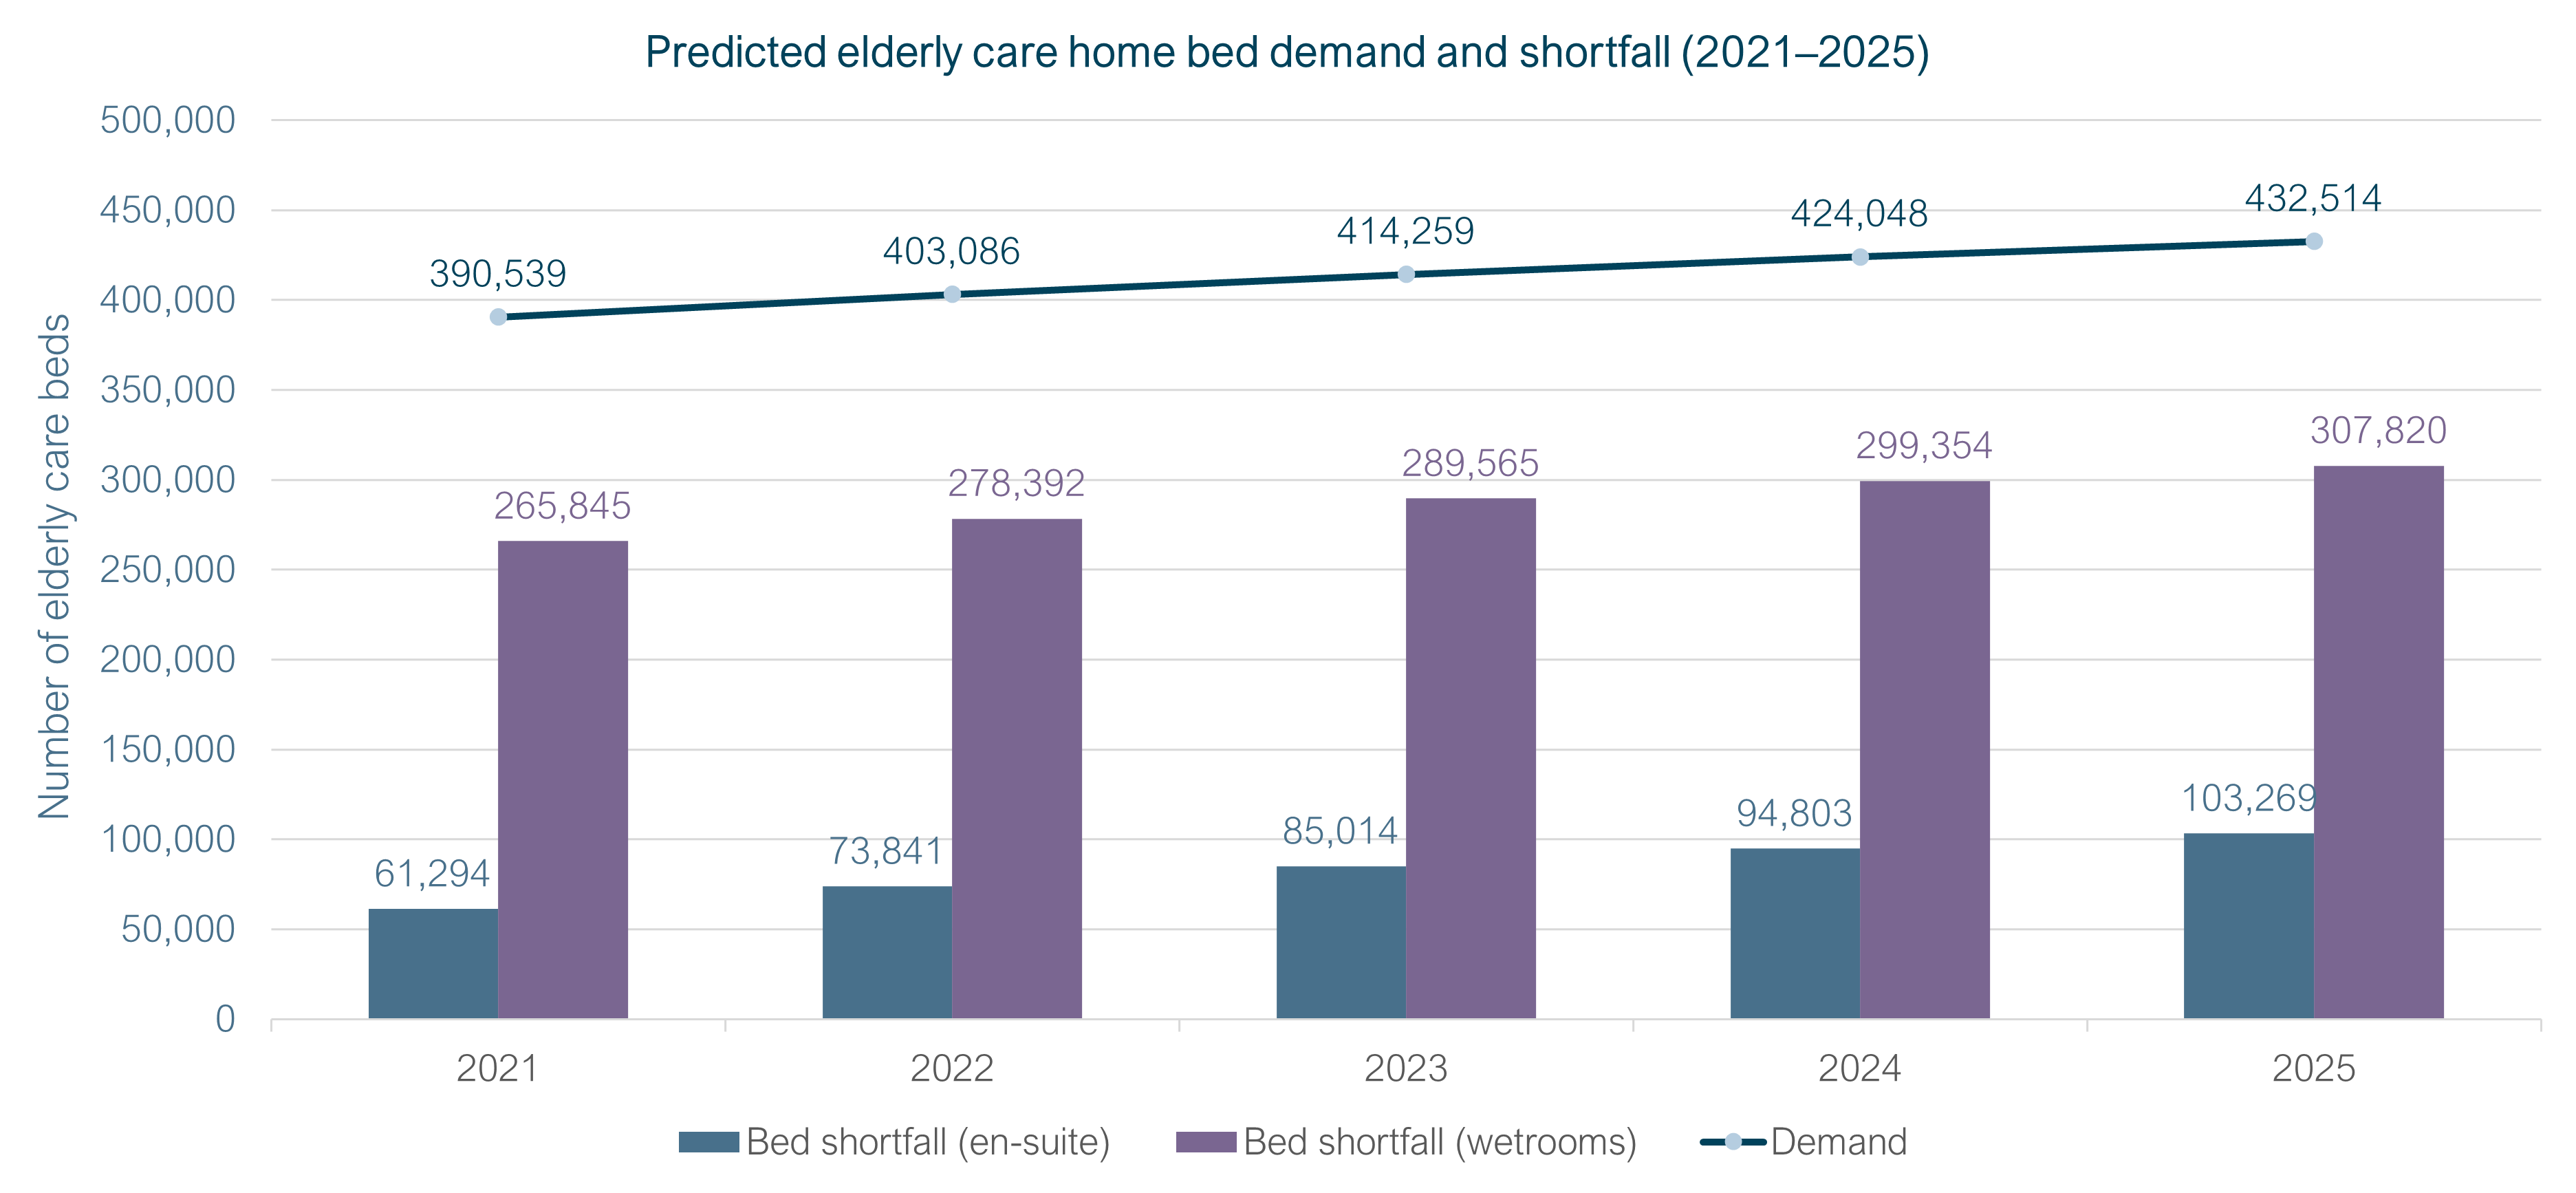
Currently, the demand for elderly care home beds sits at 390,539, a figure that is expected to increase by 11% over the next four years. As you can see from Figure 1, there is currently a shortfall of 61,294 en-suite beds, and an overall shortfall of 265,845 beds. This gap between demand for elderly care home beds, and supply of modern, futureproofed accommodation (en-suite/wetroom beds) is set to increase over the coming years.
Figure 1: 5-year demand and shortfall forecast (GB)
Sources: Census 2011, ONS, LaingBuisson, Carterwood, Centre for Policy on Ageing, Public Health England, Tomorrow’s Guides, CQC, CIW, SCI, operator websites, direct enquiries
Simply having the right quantity of beds isn’t going to be enough to meet the demand – they need to be the right type of beds. Today, the elderly care home market has just under 445,000 registered bedspaces; comfortably over the current demand; however, only 73.8% of those bedspaces offer en-suite/ wetroom facilities. The market is seeing a growth in the number of self-funding residents now paying for their own care, accompanied by the changing preferences and needs of all residents. It is clear that the current market supply is not aligned with demand, either now or in the future, with the demand for en-suite and wetroom beds only set to rise.
Meeting the unmet need
In this section, we examine two groups of local authorities, both of which are characterised by high predicted shortfalls of elderly care home provision in the future. Specifically, we’re looking at forecasts of shortfalls and provision (en-suite supply including planned beds) in 2031.
The first group have limited self-funded fee potential, due to average house prices sitting under the national average (£250k). The second group has greater self-funded fee potential, with average house prices above the national average.
Our goal here is to highlight the areas of greatest need across Great Britain, and to outline considerations for developers, operators, and investors when determining how to meet that need over the coming years.
Table 2: Areas of greatest future need with limited self-funded fee potential – top 20 local authorities (2031)
| Rank | Local authority | Balance of provision 2031 (en-suite, incl. planned beds) | Average house price |
|---|---|---|---|
| 1 | Wakefield | 1,160 | 173,373 |
| 2 | Northumberland | 1,140 | 199,698 |
| 3 | Rhondda Cynon Taf | 1,126 | 128,358 |
| 4 | Cheshire West and Chester | 1,030 | 243,706 |
| 5 | Wigan | 977 | 156,763 |
| 6 | Rochdale | 910 | 156,521 |
| 7 | Bolton | 890 | 163,021 |
| 8 | Rotherham | 819 | 158,388 |
| 9 | Kirklees | 723 | 184,973 |
| 10 | Liverpool | 718 | 148,143 |
| 11 | Caerphilly | 710 | 150,783 |
| 12 | Dudley | 702 | 191,917 |
| 13 | St. Helens | 694 | 149,412 |
| 14 | Blaby | 610 | 247,845 |
| 15 | Tameside | 575 | 163,952 |
| 16 | Wyre | 568 | 182,078 |
| 17 | North West Leicestershire | 562 | 240,484 |
| 18 | Powys | 560 | 210,143 |
| 19 | Gwynedd | 539 | 186,845 |
| 20 | Flintshire | 536 | 187,136 |
Sources: Land Registry, Carterwood, Tomorrow’s Guides, Census 2011, ONS, LaingBuisson, operator websites, direct enquiries, Glenigan, Planning Pipe, relevant local authority planning websites
Figure 3: Map of areas of greatest future need with limited self-funded fee potential – top 20 local authorities (2031)
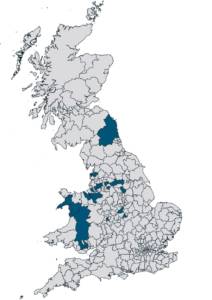
As we can see from Table 2, these local authorities have huge forecast shortfalls in provision of en-suite elderly care home accommodation in 2031. However, average house prices in these localities are lower than the GB average, with many markedly so. Local authority fees typically fall below the level that makes development and operation of new care homes viable, so the lack of a self-funded market in these locations makes the business case for meeting the need in these areas tricky.
Without meaningful reform to the way social care is funded – which we do not believe the planned Health and Social Care Levy constitutes – it is (regrettably) extremely difficult to see how the need for elderly care home beds in these local authorities will be met over the coming years.
Table 5: Areas of greatest future need with self-funded fee potential – top 20 local authorities (2031)
| Rank | Local authority | Balance of provision 2031 (en-suite, incl. planned beds) | Average house price | |
|---|---|---|---|---|
| 1 | Cornwall | 1,922 | 282,180 | |
| 2 | Camden | 767 | 1,118,796 | |
| 3 | King's Lynn and West Norfolk | 628 | 262,711 | |
| 4 | Charnwood | 594 | 250,783 | |
| 5 | South Lakeland | 585 | 281,537 | |
| 6 | West Berkshire | 560 | 418,592 | |
| 7 | Dorset | 534 | 333,091 | |
| 8 | Stockport | 511 | 269,928 | |
| 9 | Trafford | 499 | 346,238 | |
| 10 | Herefordshire, County of | 497 | 275,149 | |
| 11 | Westminster | 471 | 1,790,410 | |
| 12 | Hackney | 462 | 678,057 | |
| 13 | Forest of Dean | 453 | 267,470 | |
| 14 | Cheshire East | 440 | 289,326 | |
| 15 | Kensington and Chelsea | 425 | 2,136,963 | |
| 16 | Haringey | 415 | 654,186 | |
| 17 | East Devon | 410 | 327,771 | |
| 18 | South Norfolk | 407 | 289,801 | |
| 19 | North Norfolk | 399 | 299,342 | |
| 20 | Brent | 397 | 574,826 |
Figure 6: Map of areas of greatest future need with self-funded fee potential – top 20 local authorities (2031)
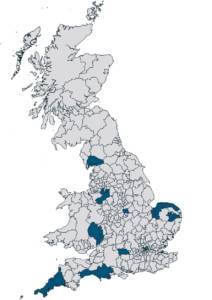
Now, when we look at the local authorities that have the greatest future unmet demand and above average house prices, it’s clear that there are areas with opportunity for real growth. These local authorities have a level of housing wealth that suggests a mixture of local authority and self-funded residents is a reasonable proposition, and covering the costs of development is possible.
When we dig deeper into the characteristics of these local authorities, there’s cause for optimism in some of the figures. For instance, every one of the 20 local authorities listed above has current average self-funded nursing care fees greater than the GB average, as well as robust £1,459 per week average for self-funded nursing care fee for the newest care homes in those areas (registered post-2015). This provides evidence that operators in these local authorities are already making a self-funded proposition work.
From a local authority funding perspective, our data shows that 67% of these 20 authorities have baseline personal care fees that are greater than the GB average (*where data is available). Again, cause for optimism that there is a viable business case for development in these areas.
The characteristics of elderly care home supply in areas with oversupply and undersupply
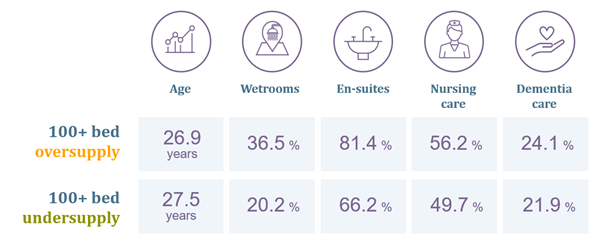
There are also interesting insights to be learnt when analysing the characteristics of the elderly care home provision in areas of both high and low need. In markets where there is an oversupply of 100+ beds, compared to those that feature an undersupply of 100+ beds, the age of the home is younger, the supply of both wetrooms and en-suites is higher, and the provision of both nursing and dementia care is greater, presenting areas of opportunity in areas with an undersupply of 100+ beds.
Figure 7: The characteristics of elderly care home supply in areas with 100+ oversupply and undersupply
Meeting the unmet need
In summary, the 2031 market needs 26,925 additional en-suite bedrooms across the 40 local authorities with the highest need. Both markets offer the potential for development, but the product for each will need to be carefully considered, ensuring it suits both the needs and expectations of the market, alongside providing an adequate return on investment.
In short, care homes are here to stay, providing the essential support that communities need to care for our elderly residents. With the funding changes outlined in the government’s recent social care reform strategy, we believe that cross-subsidies are also set to stay, potentially creating a greater mix of self-funded and local authority funded beds.
Interested in finding out more? Let’s talk
If you are interested in working with an award-winning team to help improve your strategic decision-making, we would be delighted to hear from you.
Our team of sector specialists are here to support your growth plans, providing expert market intelligence, advice and guidance at every step of your journey.
- Advisory services for the elderly care home sector
- Advisory services for the older people’s housing sector
Discover how Carterwood Analytics – our online platform for care home and retirement living market analysis – can help you:
Alternatively, why not get in touch with Tom Hartley on 07715 495062 or tom.hartley@carterwood.co.uk


