Authors: Ben Hartley, Jessica Stainthorp
This article is part of a series exploring our newly updated database of self-funded fee rates for 9,000+ elderly care homes in Great Britain, enabling us to shine a light on how fee rates change by region, as well as how the characteristics of homes correlate with the fees they quote.
You can read the previous articles in this series here:
- ‘Self-funded elderly care home fees jump 6% between Q2 2020 and Q2 2021′, which highlights how self-funded fee rates for nursing and personal care have changed over the past year, comparing data from Q2 2020 and Q2 2021, broken down by country/region.
- ‘Homes registered since 2015 retain a significant premium over older homes’, which explores the impact of age of scheme on the self-funded fee rates quoted by operators.
- ‘COVID mortality rates have no discernible impact on quoted fee uplifts in England’, exploring the impact of COVID-19 mortality rates at individual home level on quoted self-funded fees.
In this article, we focus on the relationship between fees and CQC rating (England only), and reveal a consistent trend in quoted self-funded fee premiums at homes with an Outstanding CQC rating. We also explore how a home’s CQC rating affects their ability to increase their quoted fee rates, and which categories have seen the largest fee increases and decreases over the past year.
Get the full research report now
Our full research report (PDF) is available by request and explores in thorough detail:
- The changes in national and regional quoted self-funded fees for both nursing care and personal care
- How fees break down by age of home (focusing on the sector’s newest and shiniest assets)
- How COVID-19 mortality rates have impacted on quoted self-funded fees
- What our data can tell us about the typical profile of a home with an Outstanding CQC rating
- How local authority baseline fee rates vary across Great Britain
To request a copy of the full report, please email info@carterwood.co.uk or call 01454 838038.
Elderly care homes with an Outstanding CQC rating maintain a significant premium over those rated Good
As in previous reports, we want to examine how quoted self-funded fee rates change when the CQC rating of the elderly care home is considered.
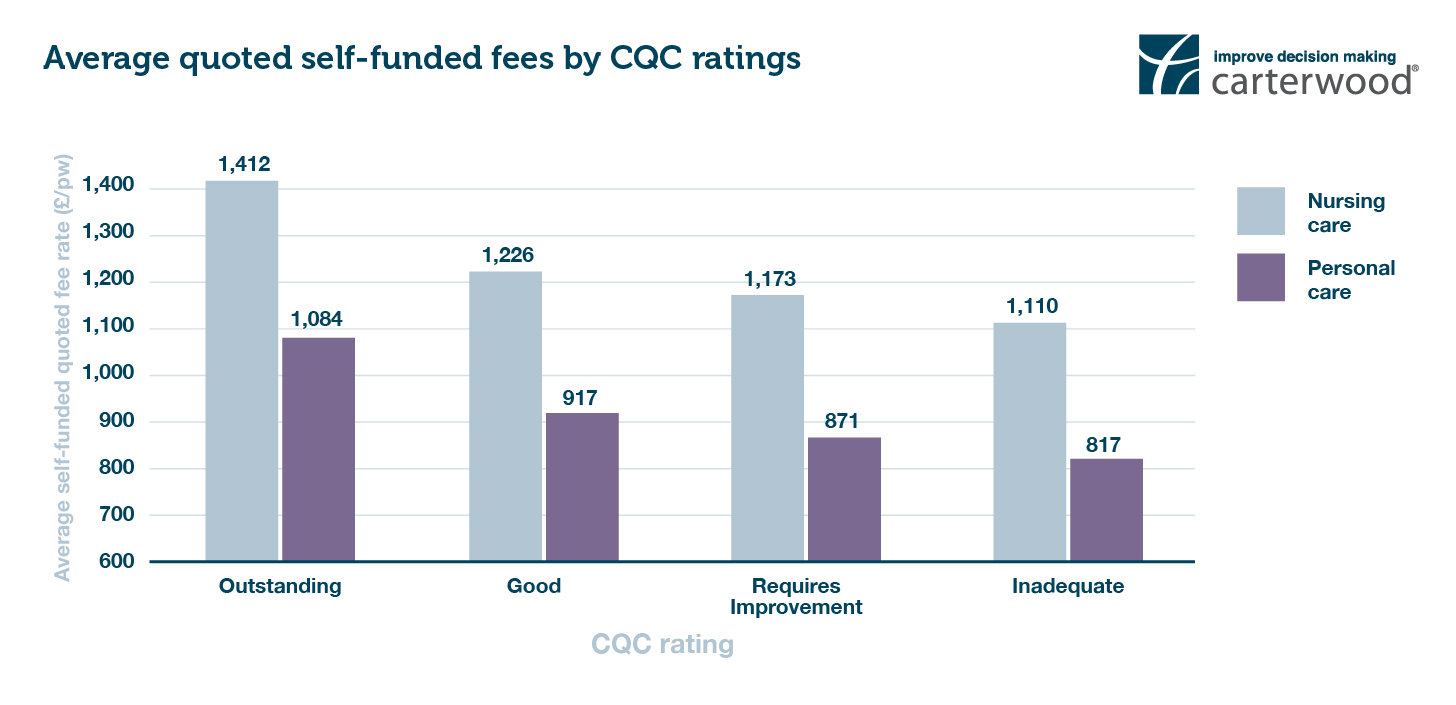
Figure 3: Mean average self-funded fee rates for nursing and personal care by CQC rating (combined OP/DE, England only)

As you can see in Figure 3 above, the pattern discernible from our previous releases is once again apparent in our Q2 2021 dataset. Homes rated Outstanding by the CQC quote significantly higher rates than homes rated Good. For nursing care, the difference is 15.2%, and for personal care it’s 18.2%.
The difference in quoted rates for homes rated Good over those rated Requires Improvement is slightly greater than in our previous update, but remains relatively small compared to the premium being quoted by Outstanding homes. For nursing care, the difference is 4.5%, and for personal care it’s 5.3%.
Average year on year quoted fee increases for homes rated Outstanding are broadly similar to those rated Good or Requires Improvement
Despite maintaining a sizeable premium over homes rated Good, when we compare our dataset for 2021 against its 2020 equivalent, it’s clear that the rate of fee increases across the CQC rating categories of Outstanding, Good, and Requires Improvement is broadly similar.
Table 3: Change in average quoted fee by CQC rating (Q2 2020 vs Q2 2021)
| Rating | Nursing self-funded - Average fee (per week) | Nursing self-funded - % change since Q2 2020 | Personal care self-funded - Average fee (per week) | Personal care self-funded - % change since Q2 2020 |
|---|---|---|---|---|
| Outstanding | £1,412 | 3.20% | £1,084 | 5.20% |
| Good | £1,226 | 5.70% | £917 | 6.40% |
| Requires Improvement | £1,173 | 5.10% | £871 | 5.20% |
| Inadequate | £1,110 | -0.40% | £817 | 0.60% |
| All* | £1,222 | 5.40% | £913 | 6.00% |
* this includes homes that have been rated by CQC and are in England
Our sample size for homes rated Requires Improvement (650 homes for nursing care / 1,336 for personal care) is robust, and suggests that this CQC rating has little impact on an operator’s ability to increase quoted fees.
However, the incredibly small number of inadequate homes in this dataset (48 for nursing care / 116 for personal care), makes it very difficult to read too much into the imperceptible changes in quoted fees for homes in that category.
Benchmark your fees against your local competitors in seconds
Carterwood Analytics – Elderly Care Homes
Carterwood’s comprehensive fee database is accessible at a local market level via our Carterwood Analytics platform. To find out more just email sales@carterwoodanalytics.co.uk.
Carterwood’s specialist reports for the elderly care home sector
Optimise your elderly care home fees by commissioning a Fee Benchmarking Report from Carterwood’s sector-specialist advisory team. Our unique dataset and deep expertise can unlock growth opportunities across your portfolio. Click here to find out more about our specialist reports or email info@carterwood.co.uk to get in touch with a member of our friendly team.


