Following on from our recent Carterwood Index: Q3 2021 release for elderly care homes, we invite you to share our quarterly snapshot of the older people’s housing market as we track essential market statistics for Great Britain.
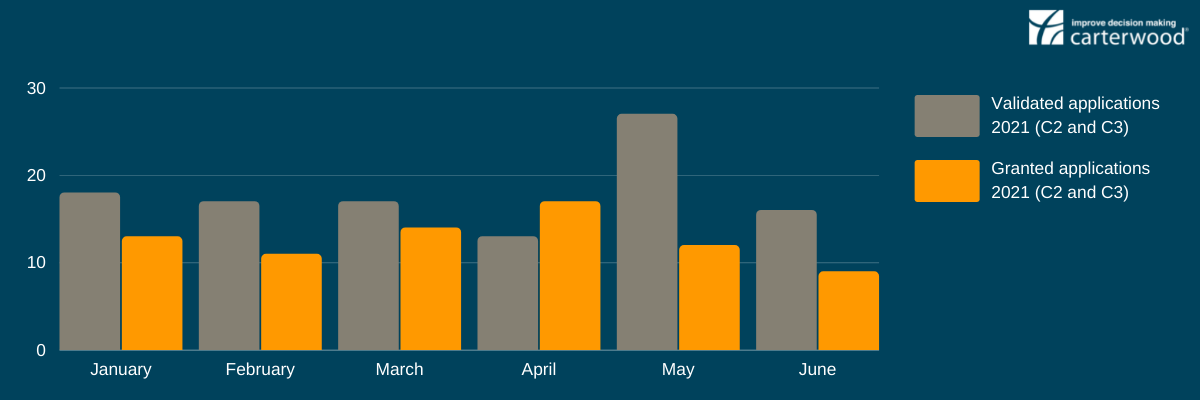
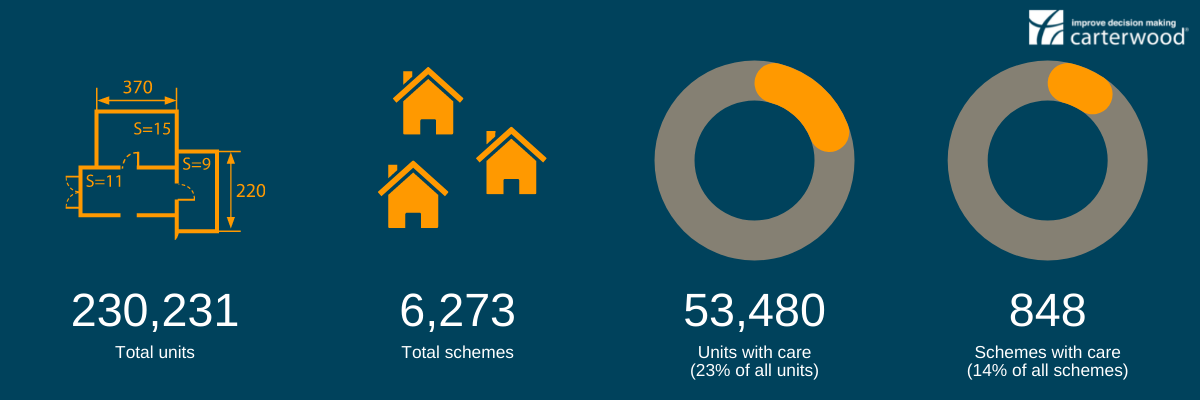
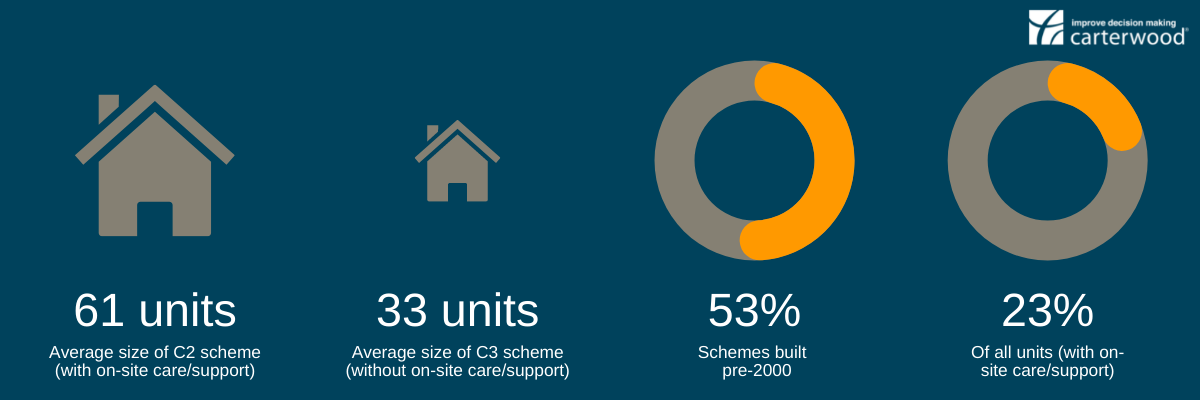
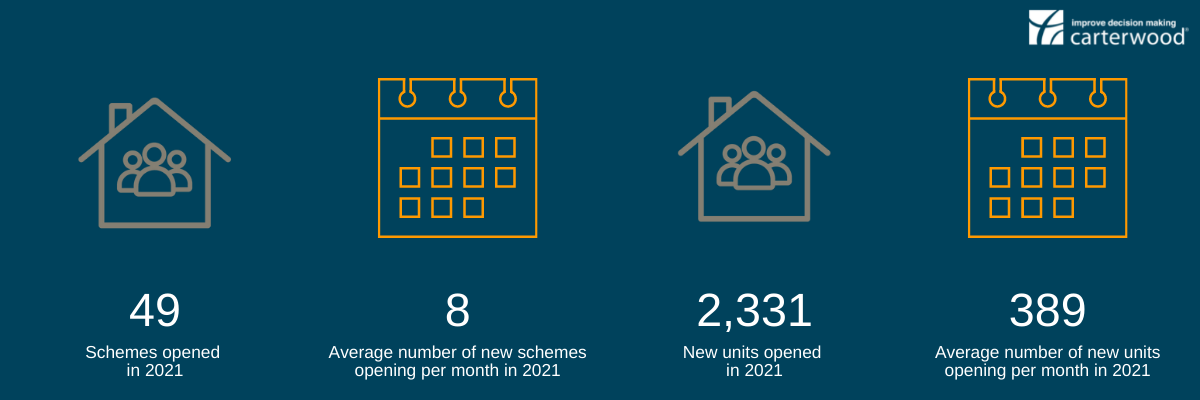
Here, we explore the size of the older people’s housing market, analyse the asset type, and share the development pace and planning activity for Q1/Q2 2021.
Market size
Asset type
Development and openings
Planning
Interested in finding out more about the retirement living market and uncovering more juicy statistics that can help guide your future developments?
Check out our new Carterwood Analytics | Retirement Living platform; everything you need to assess the viability of new retirement living schemes quicker, improve sales velocity, and maximise your sale/resale rates.
Let’s talk
If you are interested in working with an award-winning team to help improve your strategic decision-making, we would be delighted to hear from you.
Our team of sector specialists are here to support your growth plans, providing expert market intelligence, advice and guidance at every step of your journey.
- Advisory services for the elderly care home sector
- Advisory services for the older people’s housing sector
Discover how Carterwood Analytics – our online platform for care home and retirement living market analysis – can help you:
Alternatively, why not get in touch with Tom Hartley on 07715 495062 or tom.hartley@carterwood.co.uk
Notes: All figures are GB, unless otherwise stated. Updated July 2021. “With care” includes all C2 extra care and enhanced sheltered schemes. “Without care” includes all C3 sheltered housing and age exclusive schemes. Total units, not private units, are used for all metrics. No of schemes/units opened in 2021 refers to all schemes/units with a built year of 2021.
Sources: Carterwood, Elderly Accommodation Counsel (EAC), operator website, direct enquiries, HAPPI (Housing our Ageing Population: Panel for Innovation), Glenigan, Planning Pipe, local authority planning websites.


