Carterwood’s latest research, conducted by Ben Hartley (Director) and Jessica Stainthorp (Senior Analyst) highlights variations in private elderly fee rates across the East of England, London, the South East, the South West, Scotland, and investigates how fee rates vary when factors such as regulatory rating, year of first registration and dementia care provision are taken into account.
Key findings
- Care homes in England with an “Outstanding” rating have on average between 12% to 24% higher self-funded fee rates compared to homes rated “Good”. The total data sample set shows a 13.4% increase in fee rates for Outstanding vs Good homes. However, there is comparatively little difference between English homes rated across other CQC grades and there is, on balance, no difference in self-funded fee rates between a home that Requires Improvement and one that is rated Inadequate.
- Care homes in the South East charge the highest self-funded fee rates (£1,351 average). All five regions achieve over £1,000 per week for nursing care, and four of the five have average nursing care fees of over £1,200 per week. There is, however, significant variation at the local authority level.
- As expected, across all regions there is a strong correlation between age of home and fee rates with the most recent developments able to charge a significant premium over older stock. Nevertheless, self-funded average rates across all homes in Scotland and Southern England are high.
- Overall, 21% and 31% of nursing and personal care fee rates respectively show a premium for dementia care over general elderly frail rates where they are registered for both care categories.
- Fees for nursing care dementia are on average 1.1% higher than standard OP nursing care, and personal care dementia fees are 2.7% higher than standard personal care. Where homes have specialist dementia units in larger mixed registration homes and they do differentiate fee rates then the premiums are significantly higher at 4.5% and 8.4%, for nursing and personal care, respectively.
Background
Adult social care is facing the latest of a series of unprecedented challenges in the form of the COVID-19 pandemic. The sector has had to cope with various attempts to alter the legislative framework regarding the funding of long-term care; none of which have effectively got off the ground.
The introduction of National Minimum Wage, Brexit and staffing shortages have also had a big impact on operating margins. The robustness of the self-funding market remains central to the long-term sector viability given the consistently disappointing fee rates on offer from all but a handful of local authorities.
We believe that access to consistent, accurate self-funded fee data is essential to helping care homes to optimise their fees and maximise income at this challenging time.
Carterwood has collected consistent, accurate self-funded quoted fee rates for 86% of the elderly care homes with 30+ beds in the following regions: East of England, London, South East, South West, Scotland. Over the coming months our dataset will grow to cover the whole of Great Britain, including homes with less than 30 beds.
To discuss our research in more detail, request a PDF version of this research, or to find out more about getting access to our comprehensive fee data via Carterwood Analytics, contact Tom Hartley (Director) on tom.hartley@carterwood.co.uk or 08458 690777.
Regional overview
The table below shows a summary of average self-funded fee rates and house prices by region together with the data sample size and percentage coverage rate of our data.
| Region | Nursing self-funded ave fee (£) | PC self-funded ave fee (£) | Median average house prices (£) | Total number of elderly care homes (30+ beds) | CW Care home fee rate coverage (%) |
|---|---|---|---|---|---|
| East of England | 1,221 | 1,002 | 327,170 | 575 | 86% |
| London | 1,283 | 1,119 | 616,765 | 337 | 83% |
| South East | 1,351 | 1,091 | 376,483 | 950 | 89% |
| South West | 1,210 | 993 | 289,830 | 632 | 88% |
| Scotland | 1,074 | 955 | 172,736 | 419 | 79% |
| ALL | 1,241 | 1,036 | 239,708 | 2,913 | 86% |
Table 1 – Regional summary of self-funded fee rates, house prices and data coverage (CW fee data includes care homes with 30+ beds)
Fee rates are very strongly correlated to average house prices at the regional level with the more affluent areas able to charge the highest fee rates. However, there are some anomalies at the regional level:
- London has 45% higher house prices, but broadly similar fee rates compared with the South East. This relationship is driven by lack of land availability to develop more services, older age of stock in London and areas of high social deprivation which impact upon the self-funding market but are not reflected in underlying housing wealth.
- House prices in Scotland are considerably below the UK benchmark, but fee rates remain surprisingly strong particularly for personal care compared to other more affluent regions in England outside of London and the South East. This is driven by the different funding system in Scotland together with a higher proportion of purpose-built homes providing all en-suite and wetroom bedrooms.
How does CQC rating affect fees?
We have assessed average self-funded fee rates by region and by CQC rating in order to determine the strength of the relationship between operational quality and fee rate performance. This analysis does not include Scotland which has a different inspection grading system.
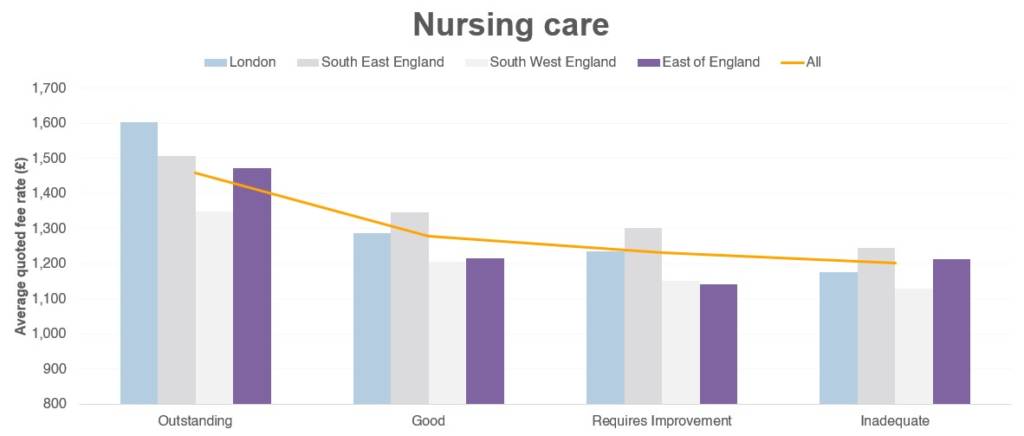 Figure 1 – Mean average fee rates for nursing care by CQC rating (combined DE/OP)
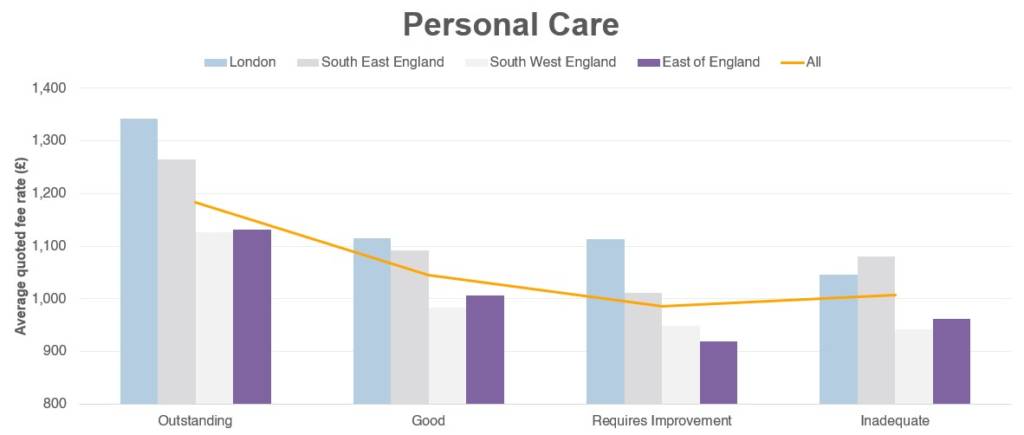
Figure 2 – Mean average fee rates for personal care by CQC rating (combined DE/OP)
There is a very strong positive impact on fee rates for Outstanding homes with these homes achieving between 11.9% and 24.4% above homes rated Good – the total data sample set shows a 13.4% increase in fee rates for Outstanding vs Good homes. The outstanding homes in our sample size comprise a complete cross section of asset types from top-end new purpose-built facilities to older style former local authority stock with no en-suites.
Although homes with a Good rating across these regions are still charging a premium above those with Requires Improvement or Inadequate, the differential is considerably less than that between Outstanding and Good. For example, the percentage uplift between Good and Requires Improvement for all homes only shows a 4.8% increase.
Interestingly, across all homes in all regions the differential between Requires Improvement and Inadequate is effectively zero, which reveals some interesting insight about the charging policy of homes when they are struggling with CQC compliance and regulatory issues – namely that it does not appear to affect the way these homes market their services and charge for their product.
Overall, the message is clear – people will pay a premium for the very best quality but there is less scope for material uplifts unless you are rated Outstanding. On the positive side, even if a home is rated as Inadequate it is unlikely to suffer material fee reductions during this period – or at least the home will not alter its charging policy for new referrals.
Local authority overview
The maps below show the distribution of fee rates by nursing and personal care (including general elderly frail care (OP), and dementia care (DE) categories), respectively across the regions assessed by lower tier / district level local authority area.
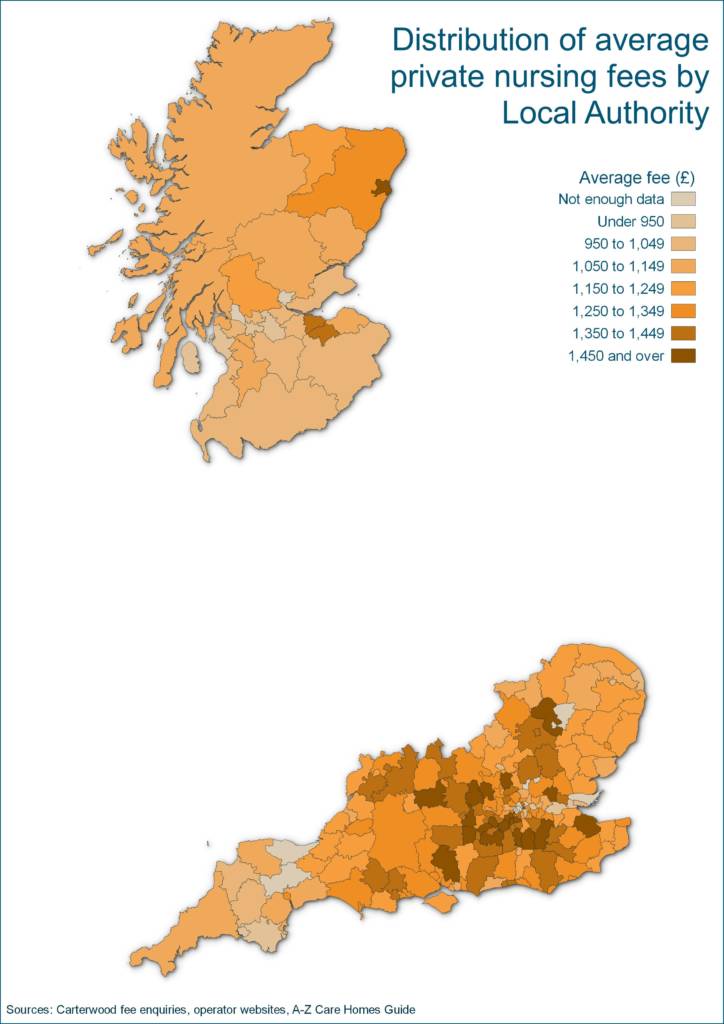
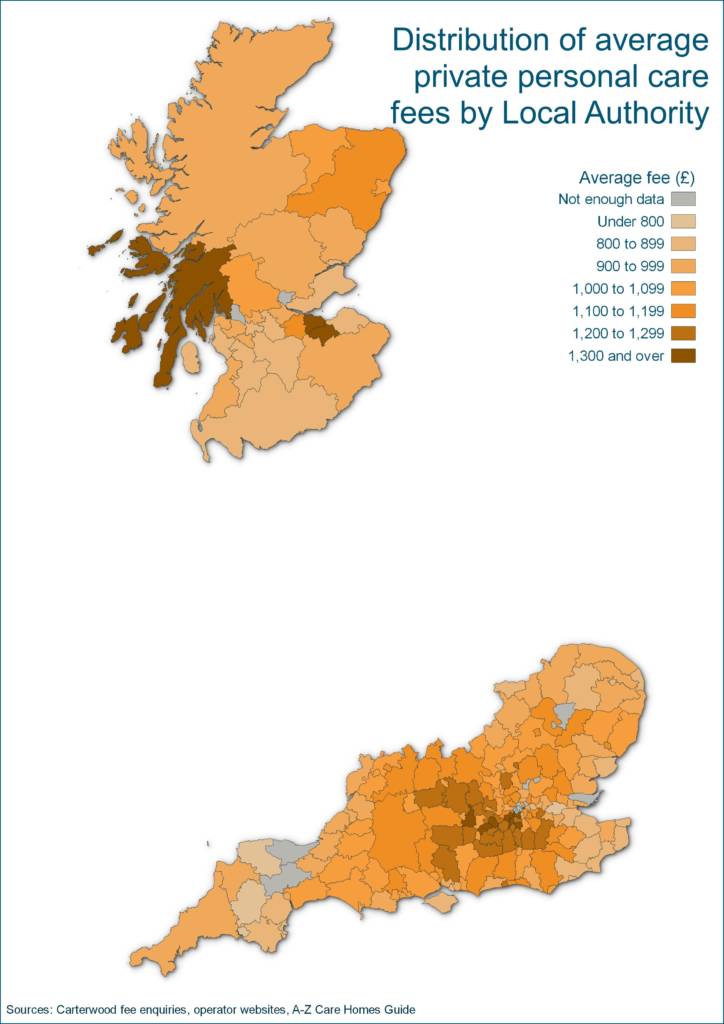
Figures 3 & 4 – Distribution of average private nursing fees by Local Authority (CW fee data includes care homes with 30+ beds); Distribution of average private personal care fees by Local Authority (CW fee data includes care homes with 30+ beds)
- There is a dense clustering of high fee rates in the South East heartland of Surrey, Hampshire, Berkshire and South West London Boroughs.
- Average self-funded fee rates fall away in the far South West, East Anglia, East London and Kent, which reflects a combination of accessibility, lower calibre stock (with far less new build activity) and lower underlying housing wealth.
- Edinburgh is the consistent high fee rate performer in Scotland, with Aberdeenshire also strong compared to the rest of the country. In Aberdeen nursing rates are very strong but personal care is significantly lower, which is due to the proportion of high calibre nursing homes in the city compared to personal care from our dataset.
(N.b. We have excluded local authorities where we have fee rate data for each care category of less than five homes as the sample size is too small to be able to enable meaningful comparison.)
How does year of first registration affect fees?
We have also analysed fee rates by year of first registration and region, using year of first registration as a proxy for asset quality.
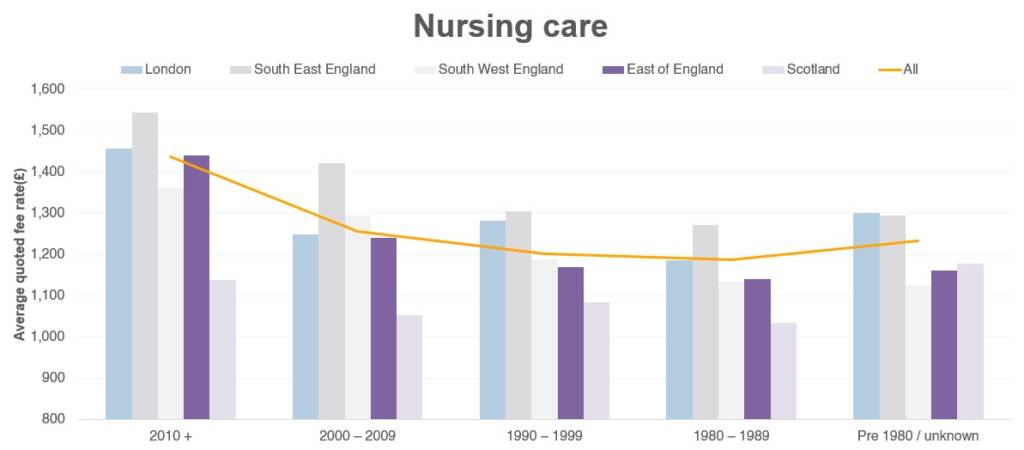
Figure 5 – Mean average self-funded fee rates for nursing care by year of first registration (combined DE/OP) (CW fee data includes care homes with 30+ beds)
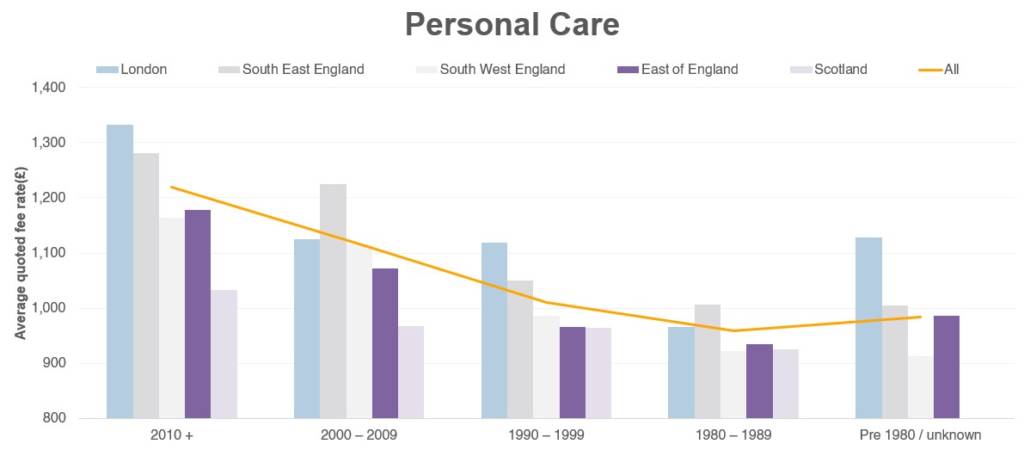
Figure 6 – Mean average self-funded fee rates for personal care by year of first registration (combined DE/OP) (CW fee data includes care homes with 30+ beds)
As we would expect, there is a very strong direct correlation between year of first registration and quoted fee rates.
However, self-funded fee rates by region are also strong throughout Scotland and Southern England regardless of age of the property – there is no region or age bracket that has nursing self-funded average rates of less than £1,000 per week.
We can also see that despite some significant shortcomings in terms of some of the older stock (including layout challenges and lack of en-suites and wetroom facilities), self-funded fee rates in a post-COVID sample size remain high at this early stage of the pandemic.
Dementia premium
In order to assess the level of dementia premium across the assessed areas, we have looked at all homes that provided separate fee rates for both general elderly frail and for dementia care. We have only assessed homes that quote both rates in order to provide the most accurate results; this reduces the sample size but provides more meaningful analysis.
| Basis of assessment | Nursing DE vs OP differential (%) | Personal care DE vs OP differential (%) | Nursing sample size | Personal Care sample size |
|---|---|---|---|---|
| All homes providing a fee for both DE and OP care categories | 1.1% | 2.7% | 1,239 | 1,467 |
| All homes with a dedicated dementia unit (inclusive of homes that charge the same for DE and OP) | 1.3% | 3.8% | 679 | 691 |
| All homes with a dedicated dementia unit (exclusive of homes that charge the same for DE and OP) | 4.5% | 8.4% | 260 | 450 |
Table 2 – Fee differential analysis for dementia care (CW fee data includes care homes with 30+ beds)
The table above illustrates the level of dementia premium across three different bases of assessment.
- The first shows the global uplift for all homes registered for OP and DE.
- The second looks at the premium for homes where there is a specialist dementia unit within a larger care home – the premium is larger here as we would expect homes that are unitised to be either differentiating their services or providing care to a higher level of dependency in specialist units.
- The third measure looks at the level of uplift for homes that have specialist dementia units and that differentiate their fees (i.e. excluding homes that charge the same fee for OP & DE clients).
The uplifts here are much higher particularly for personal care dementia and indicates that where operators do differentiate their product offering or where more specialised services can be provided there is the prospect of material fee increases.
Overall, the number of services that either choose or are able to differentiate their fee rates remains low – although again homes providing personal care have a higher proportion charging premium fees compared to nursing.
We also wanted to see what proportion of nursing and personal care homes charge a premium for dementia care, so we’ve broken that down by region.
| Region | Nursing homes charging a premium (%) | Personal care homes charging a premium (%) |
|---|---|---|
| London | 22.2% | 31.0% |
| South East | 23.2% | 30.0% |
| South West | 28.6% | 31.6% |
| East of England | 23.2% | 36.8% |
| Scotland | 11.5% | 17.1% |
| All | 21.0% | 30.7% |
Table 3 – Percentage of homes charging a dementia premium (homes registered for OP & DE)
The existence of a dementia premium has been long established in the minds of operators, but our data shows considerable variation across care categories and regions. Overall, 21% and 31% of nursing and personal care fee rates respectively show a premium for dementia care over general elderly frail rates where they are registered for both care categories.
There is a greater premium attached to personal care dementia than nursing care dementia. We consider that this is due to the greater likelihood of co-morbidities in nursing patients, potentially making dementia care requirements secondary or equivalent to underlying physical frailty or other conditions and driving less of a premium.
Conversely, for personal care dementia the level of challenge can often be greater as the physical frailty is less and dementia symptoms are more dominant, requiring higher staffing levels and better training.
How will COVID-19 affect fees?
Although all care homes are potentially at risk from viruses like COVID-19, high-quality accommodation allows residents to more effectively socially distance once there is an outbreak.
- Data about resident recovery within care homes will be critical to help restore confidence that outbreaks can be managed. The potential reputational damage of the crisis cannot be ignored and winning back public confidence will be critical in determining the speed of new admissions.
- In future, there may even be potential for private operators to charge premium fee rates for ‘COVID-free’ environments.
- Operators in harder hit areas may have to lower fees in the short term to incentivise enquiries. Competition in these areas will be intense.
- Anecdotal evidence and hard data show that COVID-19 outbreaks and their severity will vary considerably from home to home and from region to region. Highly localised work will be needed to understand the true impact for individual areas.
Future Carterwood private fee research
Later this year we plan to undertake a significantly more in-depth analysis using data covering the whole of Great Britain, enabling us to see how fees vary around Great Britain as a whole and explore how a range of additional factors affect private fee rates.
Furthermore, we intend to update our private fee data so that, most importantly, Carterwood clients have access to the most current information possible, but also to enable studies of how fee rates change over time.
To discuss our research in more detail, request a PDF version of this research, or to find out more about getting access to our comprehensive fee data via Carterwood Analytics, contact Tom Hartley (Director) on tom.hartley@carterwood.co.uk or 08458 690777.
Methodology
- We have contacted 2,913 homes to ascertain the minimum and maximum self-funded fee rates quoted by care category. All enquiries were made after 14 May 2020 to ensure consistency post-COVID main outbreak and to account for any inflationary uplifts.
- We have contacted ALL care homes caring for the elderly frail or older people with dementia and where the home is at least 30 beds in size. We have excluded all specialist homes and beds.
- All enquiries have been collected on a consistent basis using a telephone enquiry, except for six operators where information has been sourced directly from their own website where the information is sufficiently detailed in order to provide the minimum and maximum self-funded fee range.
- We have assessed fee performance against each of the following:
- Care category
- Year of first registration
- Regulatory rating (English homes only)
- This study covers the following government office regions:
- London
- East of England
- Scotland
- South East
- South West
- We have used a simple arithmetic mean average between the minimum and maximum quoted rates to calculate the average fee rates. We have not weighted the fee rates by the size of home in our calculations.
- All the data is based upon quoted self-funded rates and no adjustment has been made for top-up charges, continuing healthcare (CHC) or local authority funding.
- The data is based upon quoted self-funded rate data and the actual average self-funded fee rates and overall average rates will be lower in practice as fees can also vary markedly by service user, room type, funding source and over time.
- FNCC is included in all data.
Key terms
- N – nursing care
- PC – personal care
- OP – older people – elderly frail
- DE – dementia
- FNCC – Free Nursing Care Contribution
Sources / data attributions
- Care home fee rate data – Carterwood, operator websites
- Year of first registration – LaingBuisson
- House price data – HM Land Registry data and Registers of Scotland
- Care home base data – Carterwood, CQC, Tomorrows Guides


