Authors: Ben Hartley, Jessica Stainthorp
This article is our final instalment of our series exploring our newly updated database of self-funded fee rates for 9,000+ elderly care homes in Great Britain, enabling us to shine a light on how fee rates change by region, as well as how the characteristics of homes correlate with the fees they quote.
In order to give our clients a balanced picture of fees across Great Britain’s elderly care home markets, we collect and store the most comprehensive local authority baseline fee rate data available.
We do this at lower-tier local authority level, but are finding this data increasingly hard to accurately measure and benchmark, which we explain in more detail at the end of this section. To illustrate this, we contacted every local authority in Q2 2020 to request baseline fee rates for nursing and personal care. We received responses from 81%, of which 18% were not able to provide us with a baseline fee rate for nursing care or personal care.
Despite these challenges, it is still possible to provide a useful picture of how local authority fees vary around Great Britain, just bear in mind that our Q2 2021 dataset only covers 64% of local authorities.
You can read the previous articles in this series here:
- ‘Self-funded elderly care home fees jump 6% between Q2 2020 and Q2 2021’, which highlights how self-funded fee rates for nursing and personal care have changed over the past year, comparing data from Q2 2020 and Q2 2021, broken down by country/region.
- ‘Homes registered since 2015 retain a significant premium over older homes’, which explores the impact of age of scheme on the self-funded fee rates quoted by operators.
- ‘COVID mortality rates have no discernible impact on quoted fee uplifts in England’, exploring the impact of COVID-19 mortality rates at individual home level on quoted self-funded fees.
- ‘CQC Outstanding homes maintain a high self-funded fee premium in 2021’, discovering how quoted self-funded fee rates change when the CQC rating of the elderly care home is considered.
Get the full research report now
Our full research report (PDF) is available by request and explores in thorough detail:
- The changes in national and regional quoted self-funded fees for both nursing care and personal care
- How fees break down by age of home (focusing on the sector’s newest and shiniest assets)
- How COVID-19 mortality rates have impacted on quoted self-funded fees
- What our data can tell us about the typical profile of a home with an Outstanding CQC rating
- How local authority baseline fee rates vary across Great Britain
To request a copy of the full report, please email info@carterwood.co.uk or call 01454 838038.
Average local authority baseline fees have increased by 3% for nursing care and 2.8% for personal care
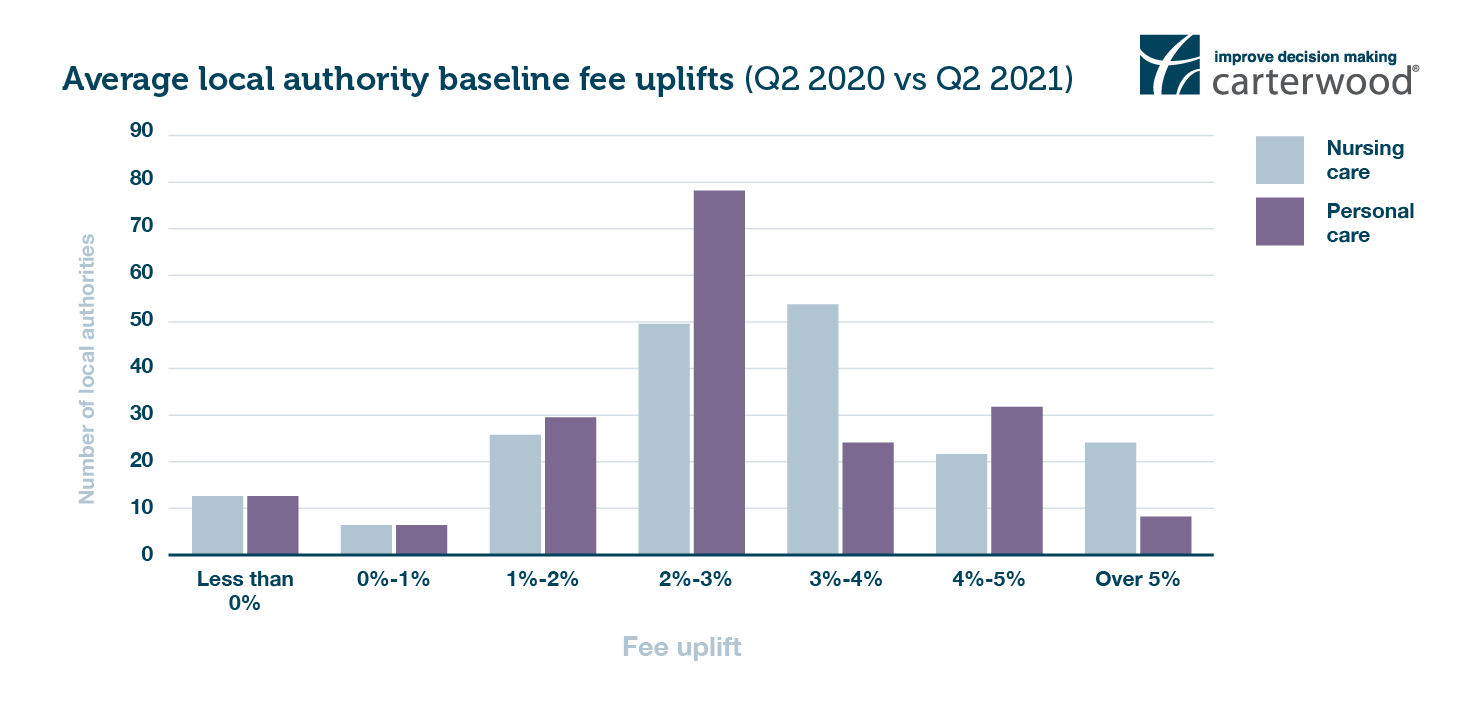
Figure 4: Distribution of local authority baseline fee uplifts, where data is available for both Q2 2021 and Q2 2020

The graph above shows the distribution of annual fee uplifts across the local authorities in our dataset, for both personal care and nursing care.
- Nursing fees have increased slightly more on average, with the median uplift for nursing fees at 3% compared with 2.8% for personal care fees. 24 local authorities have increased baseline fees by over 5% for nursing care, as opposed to just 9 for personal care fees.
- 6.6% of local authorities saw a decrease in minimum baseline rates; this is in part due to some local authorities changing from a standard model with a set fee range to reviewing fees on a case-by-case basis, greatly expanding the range of fees offered.
No discernible correlation between local authority baseline fees and geography
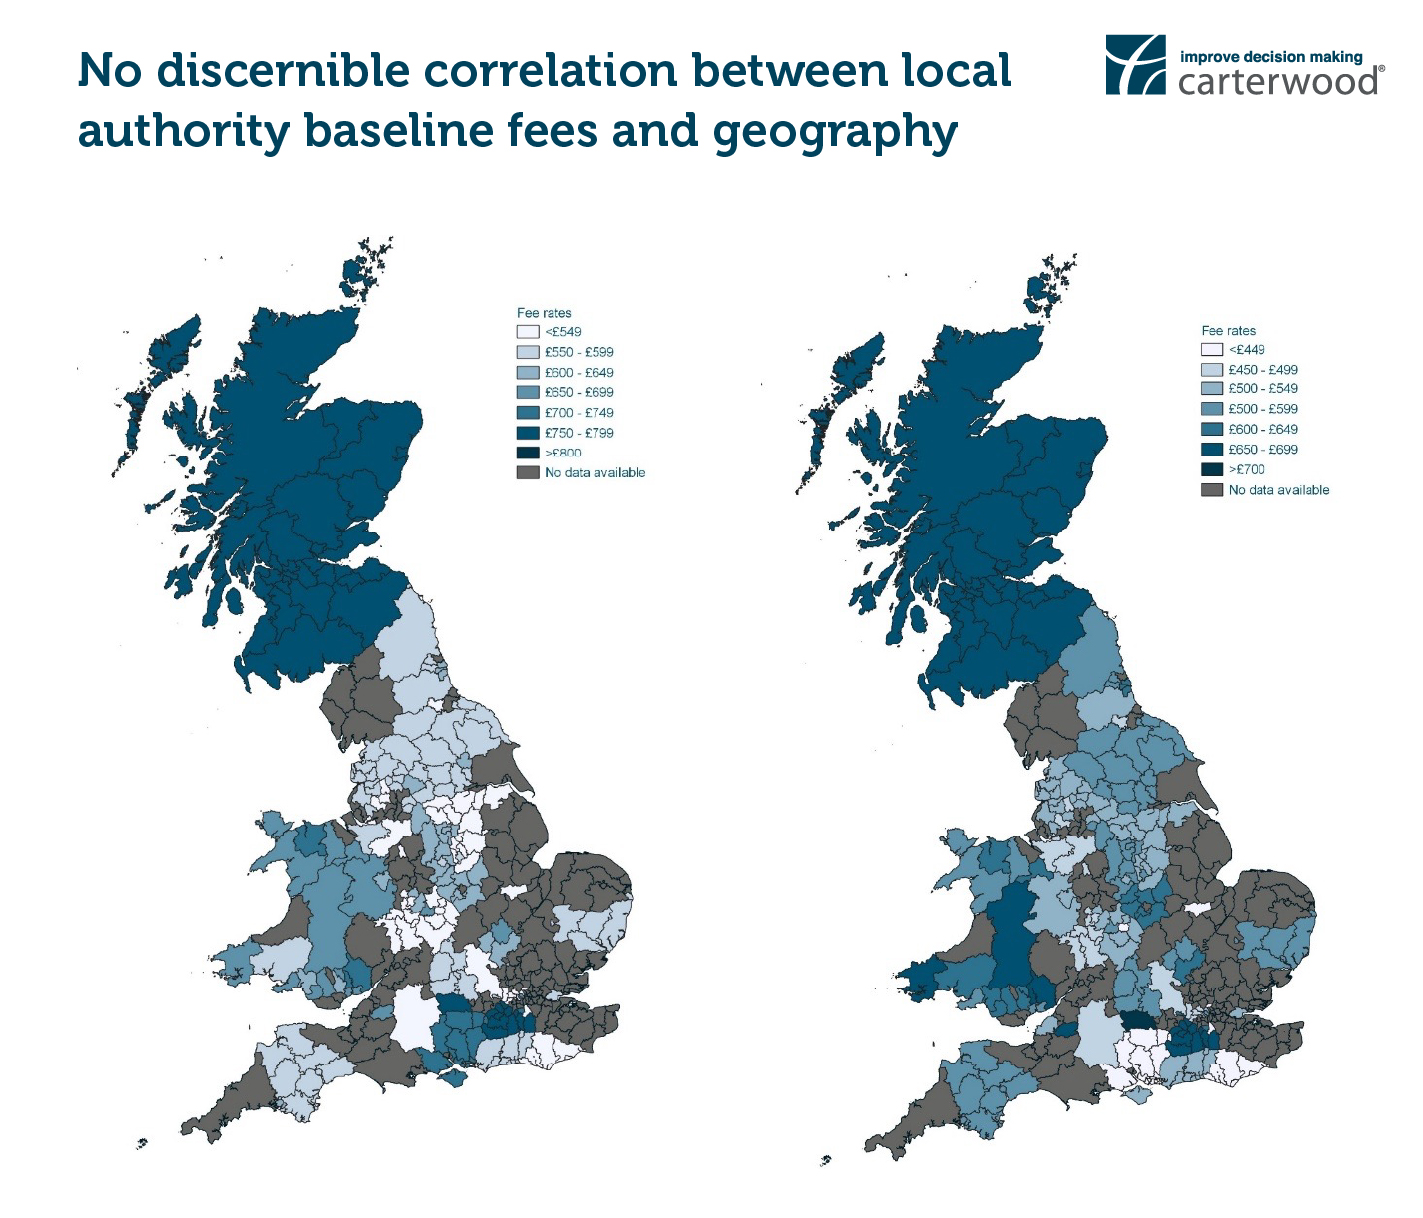
Figure 5 (left): Minimum baseline local authority fee rates at lower-tier authority level (nursing / older people)
Figure 6 (right): Minimum baseline local authority fee rates at lower-tier authority level (personal care / older people)

Please note: We are showing the minimum rate for ease of reference in the maps above and not the maximum or ‘average’ (as the data is skewed and an average would be misleading in this case). Some fee rates are set at the county level (e.g. Surrey) or national level (e.g. Scotland), and where this is the case all lower tier authorities have the same fee rate. Greyed out areas indicate that we have received no data or no minimum fee rate has been set.
As you can see from Figures 5 and 6, there is no clear-cut pattern discernible from local authority level baseline fee rates. In previous reports, we have demonstrated a clear correlation between wealth profile and self-funded fee rates, but this is not the case at the local authority baseline fee rate level.
The number of local authorities that we have been unable to source fee data from is greater than previous years, as more and more authorities have moved away from a baseline fee rate setting structure to deciding fees on a case-by-case basis. We expect this trend to continue in future.
A word on data coverage
In order to give subscribers to our Carterwood Analytics platform a balanced picture of fees across Great Britain’s elderly care home markets, we collect and store the most comprehensive local authority baseline fee rate data available.
We do this at lower-tier local authority level, but are finding this data increasingly hard to accurately measure and benchmark:
- Some local authorities now refuse to quote any fee range to us, despite a formal freedom of information request, with many local authorities reporting that they agree fee rates on a case-by-case basis subject to need.
- Many local authorities have grading systems, with fee uplifts for better CQC rating, en-suite provision, and other variables.
- The maximum fee rates quoted are now sometimes extraordinarily high, as local authorities often provide the ceiling rate for the very highest level of dependency, even though these rates are paid to a small fraction of the total number of service users supported.
- Local authority boundaries change regularly.
Despite these challenges, it is still possible to provide a useful picture of how local authority fees vary around Great Britain.
Benchmark your fees against your local competitors in seconds
Carterwood Analytics – Elderly Care Homes
Carterwood’s comprehensive fee database is accessible at a local market level via our Carterwood Analytics platform. To find out more just email sales@carterwoodanalytics.co.uk.
Carterwood’s specialist reports for the elderly care home sector
Optimise your elderly care home fees by commissioning a Fee Benchmarking Report from Carterwood’s sector-specialist advisory team. Our unique dataset and deep expertise can unlock growth opportunities across your portfolio. Click here to find out more about our specialist reports or email info@carterwood.co.uk to get in touch with a member of our friendly team.


